
Using Analytics to uncover Occupational Fraud
Occupational fraud is the use of one’s occupation for personal enrichment through the deliberate misuse or misapplication of the employing organization’s resources or assets. These are frauds are committed by individuals against the organizations that employ them. Undoubtedly occupational fraud is the costliest and most common form of financial crime in the world. The reasons why this type of crime is so prevalent is employees are entrusted with control over its assets and this very trust is being misused.
Uncovering fraud is one of the biggest challenges assurance providers and management face. While on one side they do not wish to suspect every person or transactions, but on the other end is the risk of not identifying a fraud or overlooking a red flag.
At a high level, there are three primary categories of occupational fraud.
- Asset misappropriation, which involves an employee stealing or misusing the employer’s resources
- Corruption which includes offenses such as bribery, conflicts of interest, and extortion
- Financial statement fraud schemes, in which the perpetrator intentionally causes a material misstatement or omission in the organization’s financial statements,
The Occupational Fraud 2022: A Report to the nations by ACFE (The Association of Certified Fraud Examiners) presents interesting statistics (Refer Fig 1) on the types of Occupational Frauds based on a study of 2,110 cases across 133 countries causing a loss of more than USD 3.6 Billion.
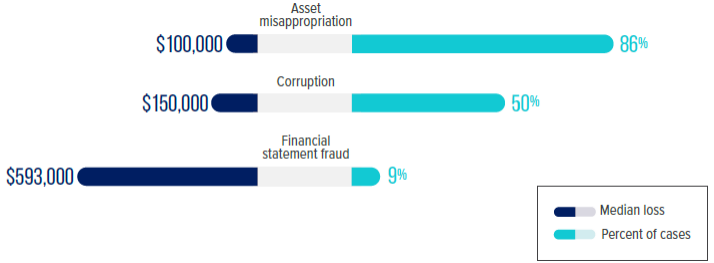
Fig: 1 How is Occupational Fraud Committed?

The Occupational Fraud 2022 report also states that a typical fraud takes more than 12 months for it to be detected with a median loss of atleast USD 8,300 per month. As anti-fraud practitioners increasing technical and internal controls, is the focus area for reducing fraud. But equally important is to identify frauds at early stages to ensure anti-fraud controls are in place. Data analytics plays a crucial role in the discovery of these types of frauds. Let us delve a little detail into how one could use Analytics for unearthing Frauds.
Using Analytics for uncovering Frauds
The use of proactive data monitoring and analysis is associated with lower fraud losses and quicker fraud detection. The use of data analytics is a powerful fraud prevention, detection and investigation tool, and an important part of an effective and holistic fraud risk management program.
The following are the important Data Analytics functions one could use to uncover Frauds:
| Type of Function | Description | Sample Scenario |
|---|---|---|
| Column Statistics | Displays column-wise statistics of all numeric, date and numeric, date and character columns | To Profile and analyse data at a Macro Level |
| Identify Duplicates & Gaps | Identify Duplicates in a series of data or displays all successive numeric numbers with defined intervals | Identify Duplicate POs, Duplicate Vendor Payments, Duplicate Vendors, Payments without descriptions |
| Same-Same Different | Identify Duplicates in a series of data which have certain fields which are common and certain fields which are different | Identify Duplicates based on same GSTN, different location, name etc |
| Pareto | Displays items in two separate tabs of 80:20 | Profiling Payments into High, Medium & Low |
| ABC Analysis | Displays items in three separate categories as per the same percentage given for each category. | |
| Quadrant / Pattern Analysis | Displays items in four quadrants as per the specific same percentage given for each category. | |
| Relative Size Factor (RSF) | Displays the variation between highest value and 2nd highest value (in terms of difference and proportion). | Deriving vendor ratio of highest and 2nd highest bill and check ratios beyond a "x%" |
| Max Variance Factor (MVF) | Displays the variation between highest and lowest value (in terms of difference and proportion). | Deriving vendor ratio of highest and least bill and check ratios beyond a "x%" |
| Benford Law | Displays variance in patterns of numeric data based on Benford Law for first digit beginning with 1 to 9. It states that lists of numbers from many real-life sources of data are distributed in a specific and non-uniform way. Number 1 appears about 30% of the time. Subsequently the number 2 occurs less frequently, number 3, number 4, all the way down to 9 which occurs less than once in twenty | Identify Payments which fall as an exception to Benford's Law |
| Authentication Check | Compare & verify if the amounts processed are within the limits and approval hierarchy. | Verify Segregation of Duties, instances of exceeding limits |
| Pivot Table / MIS | Summarizes data by sorting, averaging, or summing and grouping the raw data MIS can summarise by criteria such as day, day of the week, month etc. | Summarise and reporting payments based on defined rules |
| Outliers | Displays instances of transactions beyond "x" times the average, mean, standard deviation etc | Identify Payments beyond "x" times the average, standard deviation etc. |
| Sounds Like / Soundex / Fuzzy Match | Identify vendors with similar names, which sound same based on the phonetics | Identify duplicate / fake Vendors created |
| Aging Analysis | Computes difference of selected two date columns & stratifies on specified intervals for computed date difference. | Identify cases of payments made beyond a specified date |
| Trendlines | Displays trendline as per different rules configured using sparklines or chart. | |
| 3-Way Matching | Displays records after joining data from up to three worksheets based on common/ uncommon column values. | Identify cases of mismatch between PO, RR and Payment |
| Analytical Review | Displays the difference between values of two numeric columns in number and in percentage. | Analyse the quantitative and other related information |
| Back-Dated Entries | Identify back-dated entries, duplicates/gaps based on selected numeric/alphanumeric field related to date field based | Identify instances of prior period payments and other related checks |
| Beneish M-Score | The Beneish model is a statistical model that uses financial ratios calculated with accounting data of a specific company to check if it is likely that the reported earnings of the company have been manipulated | Identify exceptions to the Benish Score and analyse further |
| Identify Outliers by Masks | Displays records that do not match a defined mask where 'C' represents characters and 'N' represents numbers. | Identify transactions which do not follow a specific pattern. |
| Sampling | Perform Sampling by Outliers, Characters, Numeric, Risk weightage, statistics, quadrants, clusters, interval | Sample based on exceptions to test the controls and perform substantive procedures |
| Splitting Vouchers | Multiple vouchers raised on same date or similar dates having cumulatively are higher than the approval limit | Identify policy exceptions |
| Rounding off | Identify high value and round sum vouchers | |
| Weekend Payments | Identify entries / payments made on weekends | |
| Vouchers with Blank Reference and Narrations | Identifying vouchers of different fields which are blank |
Using the above techniques to uncover Occupational Fraud
The below are possible analytical tests one could perform to uncover occupational fraud:
| Scenario | Possible Analytical Tests |
|---|---|
| Bribery / Kick backs | 1. Co-relate large expense reimbursements or cash withdrawals or unrelated payments made prior / post obtaining a large contract. 2. Identify payments to agents that are not located in the customer/sales regions. 3. Analyse payments to out-of-country accounts or out of context pay-outs 4. Identify incidental payments made to persons not having any contracts or agreements or proof of work completion immediately after receipt or disbursal of funds for the original contract 5. Analyse narration / free-text payment descriptions for high-risk keywords such as "expedite fee," "facilitation payment," or “entertainment” government liaison or random names. |
| Bid Rigging Data Analytics Tests | 1. Review the bids submitted and identify similarities in the format and content / address of the bidders 2. Investigate sole-sourced or exceptionally low bids on contracts. 3. Perform a RSF (Relative Size Factor test) and Maximum Variance Factor on the bidding prices. 4. Check for split contracts with vendors to identify orders that are below approval or bidding thresholds. 5. Verify bidders GSTN to check if they fictitious bidders. |
| Purchase Frauds | 1. Compare purchases by ordering clerk for each vendor and product to identify vendor preference pattern. 2. Compare goods inspected by inspector for each procurement and product to identify preference pattern. 3. Analyse One-time vendors with expedited payments. 4. Compare employee names, addresses, and account information to vendor master information to identify potential conflicts of interests or hidden relationships 5. Check if Inventories |
| Sale Frauds | 1. Compare sales prices and/or margins for products by customer to identify if products were sold at lower rates. 2. Compare sales prices and/or margin by employee for each customer and product to identify any unusual pricing patterns. 3. Identify outstanding accounts receivable and analyse connection of respective customer information with known shell companies or sanctions lists. |
| Payment Related | 1. Review list of open / dormant purchase orders without any activity. 2. Identify and investigate invoices that did not pass the three-way-match (purchase order, goods receipt, and vendor invoice) before the related liability was recorded. 3. Extract vendors with incomplete profiles, especially those with missing GSTN or address details 4. Identify payments where payments and purchase are approved by the same person |
| Payroll related | 1. Compare list of employees with the Provident Fund UAN numbers to identify duplications / similarities. 2. Extract multiple payroll payments to the same bank account for a month. 3. Compare bank accounts and address details of employees and vendors to identify similarities 4. Compare employee pay out with attendance and timesheets records. 5. Check for employees with no time off for vacations or sick leave |
| Reimbursements | 1. Compare the nature of reimbursement with the 2. Identify business travel with departures on Friday or Saturday and returns on Sunday or Monday and verify business purpose 3. Compare and contrast flight details with the cab booked to and from the airport 4. Identify expenses with missing required information such as dates, times, or purposes of expenses. |
| Fictious Revenue | 1. Analyse the cash back components / discounts / reversals issued towards the period end or beginning of the next period. 2. Compare gross margin by period and identify any outliers. 3. Perform a key word search on sales / accounting teams to identify words indicating pressure, opportunity, adjustment etc. |
| Hidden liabilities | 1. Identify cases where payments made without proof of delivery of completion 2. Stratify expenses by month and to prior year and investigate outliers. 3. Identify cases where there are delayed payments or submission of invoices. |
Concluding Thoughts
By using Analytics based approach uncovering fraud could much easier. While this could result also result in identification of red flags or false positives, it is worth examining to ensure frauds are curbed or prevented at early stages.
Author
The author CA Narasimhan Elangovan, is a practising CA and partner KEN & Co. He is a GRC Professional, a Digital transformation catalyst and an author. He believes in the power of technology to solve everyday problems. He can be reached at narasimhan@ken-co.in
